Using J-SHIS Maps
1. Finding out about Active Faults
Start J-SHIS Maps. Tick “Major Active Fault Zones” checkbox in the “Seismic Source Fault” box in the sidebar to show the location of major active fault zones.
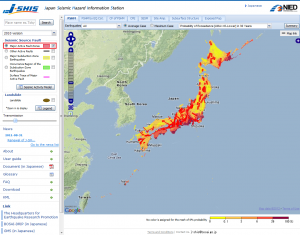
Major Active Fault Zones
Choose the “Major Active Fault Zones” radio button in the sidebar. Zoom in the map, and click on a specific fault zone to find out the details of it.
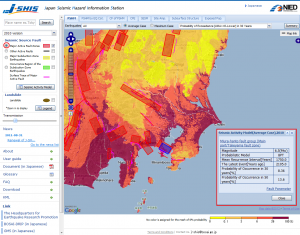
Miura-hanto fault group
Click on the “SESM (Scenario Earthquake Shaking Map)” tab in the toolbar. The strong motion simulation result in JMA seismic intensity will show up as a map in the occurrence of a scenario earthquake.
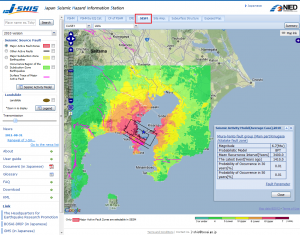
Strong motion simulation result in JMA seismic intensity (Miura-hanto fault group)
2. Finding out about Subduction-Zone Earthquakes
Tick the “Major Subduction-Zone Earthquakes” checkbox in the “Seismic Source Fault” box in the sidebar. The area of subduction-zone earthquakes will show in yellow. Also, tick the “Occurrence Region of the Subduction-Zone Earthquakes” checkbox to show the occurrence region in green.
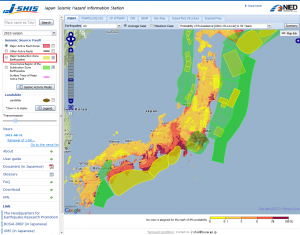
Source fault of Subduction-Zone Earthquakes
Click on the radio button and tick the checkbox for “Major Subduction-Zone Earthquakes” in the sidebar. Then click on the yellow-colored source fault of a specific subduciton-zone earthquake to show the detailed information of it.
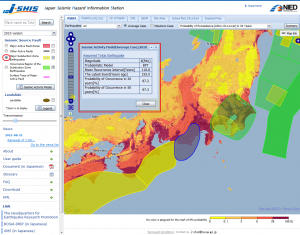
Assumed Tokai Earthquake
After choosing the “CPE (Conditional Probability of Exceedance)” tab in the toolbar, choose “Expected IJMA” from the select box to see the strong motion simulation results in JMA seismic intensity as a map in occurrence of a scenario earthquake.
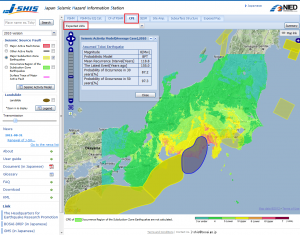
Strong motion simulation result in JMA seismic intensity (Assumed Tokai Earthquake)
Select the “Exposed Pop. (Exposed Population)” tab in the toolbar. The distribution of population exposed to a certain level of seismic intensity in the occurrence of a scenario earthquake will appear. You can change JMA seismic intensity in the select box, and daytime/nighttime population in radio buttons.
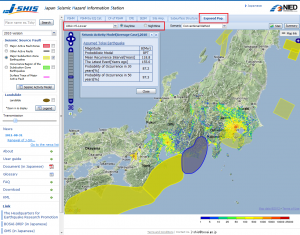
Exposed Population (Assumed Tokai Earthquake)
Click on the “Stat” button to show the statistics over the whole of Japan, each prefecture and city.
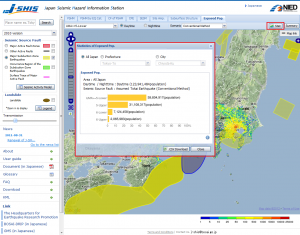
Statistics (Assumed Tokai Earthquake)
3. Finding out about Geologic information
Select the “PSHM (Probabilistic Seismic Hazard Maps)” tab in the toolbar. You can enlarge the map and double click on the specific location to find out about its site amplification factor, probability of exceedance and expected seismic intensity within the next 30 or 50 years, peak ground velocity from the engineering bedrock to the ground surface, and so on.
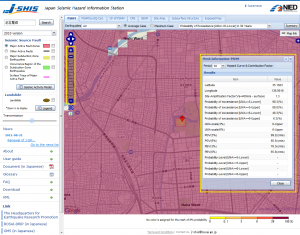
Estimation result (around Nagoya Castle)
Click on “Hazard Curve and Contribution Factor” to show the hazard curve and contribution factor of a particular location in graphs.
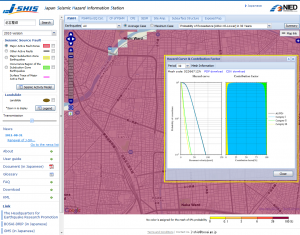
Hazard curve (Around Nagoya Castle)
Click the “Site Amp. (Amplification Factor)” tab in the toolbar and select “Site Amplification Factor” in the select box. You will see the distribution of amplified ratio calculated from the engineering bedrock (Vs=400m/s) up to ground surface.
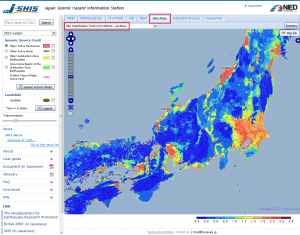
Site Amplification Factor
Select “Average Shear-Wave Velocity in the Upper 30m (AVS 30)” in the select box to show the distribution of 30m depth average S-wave velocity calculated from the engineering geomorphologic classification.
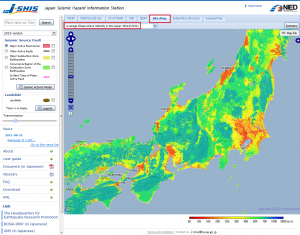
AVS30
Select “Engineering Geomorphologic Classification” from the select box. 250m mesh engineering geomorphologic classification will appear. Click on “Detail” to show its detailed legend window.
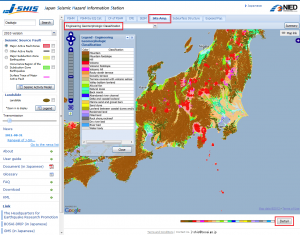
Engineering Geomorphologic Classification
Click the “Site Amp. (Site Amplification)” tab in the toolbar, and then enlarge the map further. By double clicking on a specific location, engineering geomorphologic classification, 30m depth average S-wave velocity, and site amplification factor will appear.
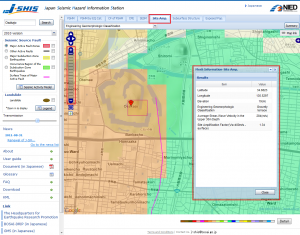
Site Amplification (Around Osaka Castle)
Click on the “Subsurface Structure” tab in the toolbar to show the map of 3D deep subsurface structure model down to the engineering bedrock, and to the seismic bedrock on the whole of Japan. The depth of the upper boundary in each layer can be changed from the select box, and the depth or elevation by the radio buttons.
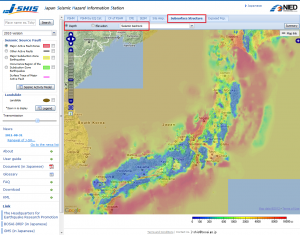
Deep Subsurface Structure
Click the “Subsurface Structure” tab. Enlarge the map and double click on the specific location to show the distribution of arranged columnar section, P-wave velocity, Shear-wave velocity, and density (kg/m3) in graphs, respectively. The depth can be changed in the select box.
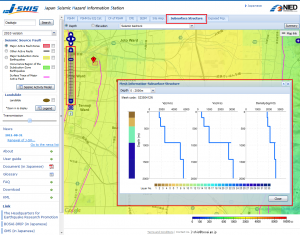
Deep Subsurface Structure (Around Osaka Castle)

