Category I,II,III


When the zoom level of map view is 11 or more, you can see detailed information of a mesh.
Mesh Information window about 250 m mesh (shown with a red rectangle in the map view) that you double-clicked appears.
An example, Mesh Information window about PSHM with the zoom level 13, is shown below.

Examples of Mesh Information window for each tab are shown below.
| PSHM | Averaged Hazard | PSHM by EQ Cat. Category I,II,III |
|
|
|
| PSHM by EQ Cat. CF of PSHM |
CPE | SESM |
 |
 |
 |
| Geomorphologic Classification | Site Amp. | Subsurface Structure |
 |
 |
 |
NOTE: To see Mesh Information window about CPE and SESM, select a source fault prior to double-clicking the map. Mesh Information window is not available on Exposed Pop. tab.
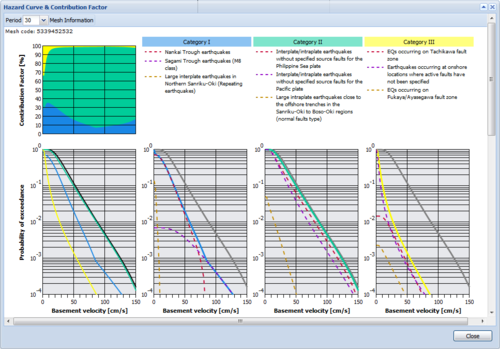
You can see each graph by clicking "Hazard Curve & Contribution Factor" button in Mesh Information window about PSHM.
The contents to be displayed is differ depending on Reference year of PSHM selected at Sidebar.

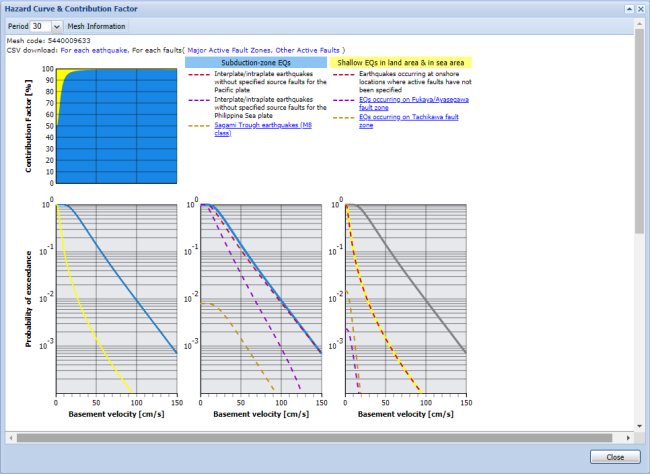
You can download the data of a hazard curve at the selected mesh by clicking links "PDF download" or "CSV download" in the Mesh Information window.
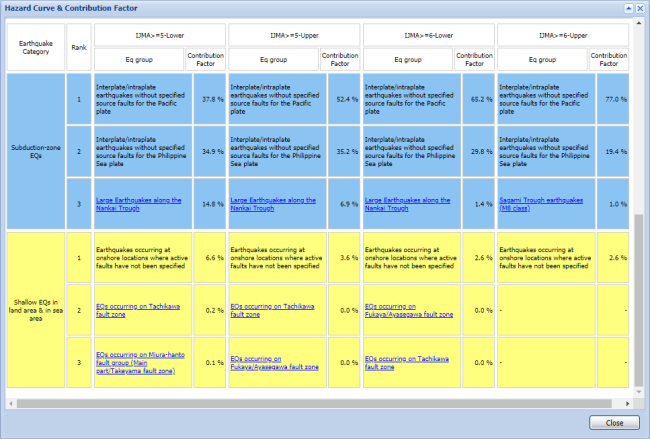
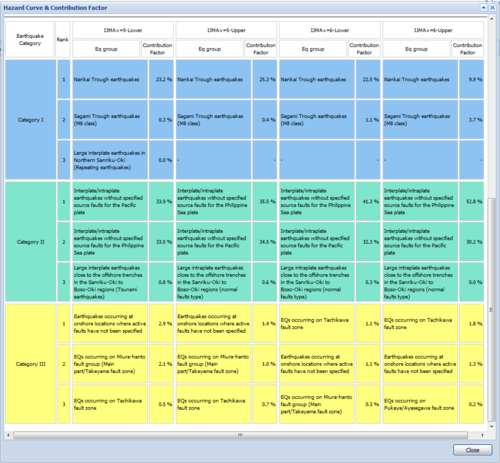
In addition to hazard curve and contribution factor for earthquake category, you can see hazard curves for earthquake groups which of contribution factor is ranked in the top 3 of each earthquake category.
The contribution factors are also shown by a table.
Hazard curves of the top three earthquake are shown in relation to both subduction-zone EQs and Shallow EQs in land area & in sea area.
The table describes contribution factor of the top three earthquake groups with the highest impact is also shown.