User Guide to the J-SHIS, Japan Seismic Hazard Information Station
This user guide describes the J-SHIS Web site.
Click a symbol or a frame to jump the explanation of each function.
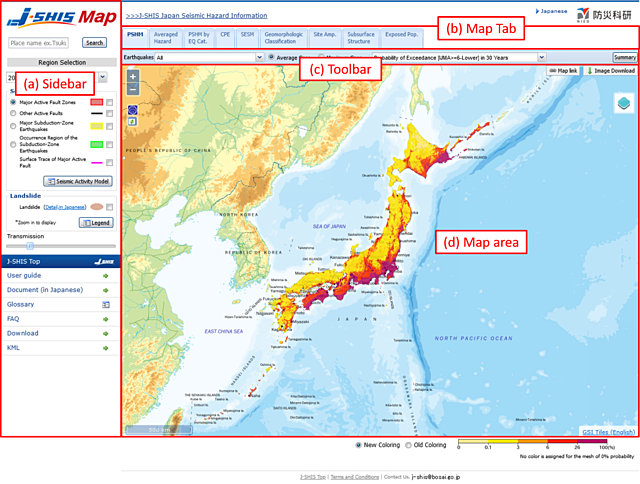
Functions of each area

|
- (1) Location search
- Finding places and displaying search results by building name, place name, address, and so on.
- (2) Region Selection
- Region Selection
- (3) Reference year
- You can change the reference year of PSHM.
- (4) Select/Display faults
- Using the radio button left-side, select type of seismic source fault to operate on the map.
And, using the checkbox right-side, show/hide seiscmic source fault on the map for each type.
- (5) Seismic activity model
- Click to open a window describing information of seismic activity models based on
the long-term evaluation by Earthquake Research Committee.
- (6) Landslide
- Controls about the landslide map. Show/Hide checkbox and legend window button are available.
- (7) Transmission
- Setting transmission of layers on the map.
- (8) J-SHIS Top
- Click to open J-SHIS Top page.
- (9) User guide
- Click to open the user guide to the J-SHIS (this page).
- (10) Document
- Click to open a PDF file (in Japanese) of guide document of the national seismic hazard maps for Japan.
- (11) Glossary
- Click to open a glossary window for the J-SHIS. You can read an explanation of each earthquake category.
- (12) FAQ
- Click to open the FAQ (Frequently Asked Question) page.
- (13) Download
- You can download the data of various types of seismic hazard maps.
- (14) KML
- You can download the KML files of various type of seismic hazard maps.
|
(b)Map Tab

Click a tab to select a map
- Probabilistic Seismic Hazard Maps (PSHM)
-
The probability that ground shaking exceeds a certain level of intensity at a site for a certain period
(within next 30 or 50 years) is called "exceedance probability".The Probabilistic Seismic Hazard Maps (PSHM)
can either show a distribution of ground motion intensity or exceedance probability by fixing one of them in turn.
For example, "Seismic intensity of PSHM, for a 3% exceedance probability within 30 years" means the ground shaking
will occur with 3% probability within 30 years.There are two type PSHM of maps: "Average case" and "Maximum case",
results from computing probability of occurrence respectively, by using the mean values of average EQ activity interval
and the latest event, and by using the smallest value of the mean EQ recurrence interval and the oldest event.
- Averaged Hazard
- Averaged Hazard Map shows the expected intensities of earthquake ground motions with long-term return period such as 500-100,000 years. The map is created to represent an effect of earthquake that has relatively low probability but could cause strong motion. All of earthquakes in the map are evaluated as Poisson process in seismic activity model. For example, a map of "Return Period of 1,000-year", which is equivalent to "3% Probability of Exceedance in 30 Years" in PSHM shows distribution of intensities that will possibly experience once in 1,000 years.
The number of earthquakes involved varies strongly depending on the return period. Effects of earthquakes with lower frequency are covered as the return period increases.
-
- Earthquakes around Japan can be cataloged by the return periods as:
- 1,000-year: Major subduction-zone earthquakes
- 10,000-year: Almost all of subduction-zone earthquakes and earthquakes on major active fault zones
- 100,000-year: Almost all of earthquakes including those of without specified source faults
Even if each of occurrence frequency is once in 100,000 years, an earthquake will occur once in 10 years on anywhere around Japan if there are 10,000 such earthquakes.
Following facts may be helpful to understand the long-term return period. The number of destructive earthquakes occurred in Japan (death toll over 50) in the past 200 years is known as 23 times and its occurrence frequency is about once in 10 years. It corresponds to each of occurrence frequency is once in 100,000 years.
- PSHM by Earthquake Category (PSHM by EQ Cat.)
-
- -PSHM by Earthquake Category (PSHM by EQ Cat.)-
-
The earthquakes are grouped into three categories in terms of its properties to make the seismic hazard information usable well.
PSHM by Earthquake Category indicates probability distribution on the given groups in quartiles (*) to show its relative influence in whole of Japan.
(*)Four colors are allocated to represent the four equivalent-quantities of datasets
where the whole meshes are sorted based on its exceedance probability with a descending order.
- -Contribution Factor of PSHM (CF of PSHM)-
- The PSHM Contribution Factor maps display distributions of the most contributive earthquake category,
which are based on the exceedance probabilities of each category.
The Contribution Factor at each site varies dependent on the ground motion level.
- Conditional Probability of Exceedance (CPE)
-
Maps of Conditional Probability of Exceedance (CPE) show the exceeding probabilistic map that ground shaking exceed
a certain level of seismic intensity when scenario earthquakes occur. Maps of the expected seismic intensity show
the distributions of the average value of seismic intensity when scenario earthquakes occur.
- Scenario Earthquake Shaking Map (SESM)
-
Scenario Earthquake Shaking Map (SESM) shows the strong motion simulation results when a scenario earthquake occurs.
- Geomorphologic Classification
-
This map offers the geomorphologic classification map in a standard area mesh in whole of Japan,
approximately 1km and 250m square. Classifying the geomorphologic attribute, as the higher spatial resolution about 250m square,
has improved in the 2009 (and later) version map.
- Site Amplification Factor (Site Amp.)
-
- -Average shear-wave velocity in the upper 30m depth-
-
This map shows the 30m depth average S-wave velocity calculated from the engineering geomorphologic classification,
which has improved from the 2009 version.
- -Site amplification factor-
-
This map shows amplification factor map obtained from the 30m average S-wave velocity(AVS30),
which has improved from the 2009 version. The amplification factor means amplified ratio calculated
from the engineering bedrock (Vs=400m/s) up to ground surface.
- Deep Subsurface Structure (Subsurface Structure)
-
The map shows the 3D deep subsurface structure model down to the engineering bedrock, and to the seismic bedrock,
in order to carry out the strong motion simulation. The maps show distribution of elevation and depth of the upper boundary
of the each layer by color gradation.
- Exposed Population (Exposed Pop.)
-
Maps of the PEX (population exposure to seismic intensity) show distribution of population exposed to a certain level of
seismic intensity during a scenario earthquake. The maps displayed by "Average" are the PEX maps obtained from an expected IJMA,
which shown at the "CPE" tab. The maps displayed by "CASE N" are the PEX maps obtained from an IJMA of the CASE N,
which shown at the "SESM" tab. The populations of night time is based on "2005 Population Census".
The populations of day time is based on "2006 Population Census, Establishment and Enterprise Census".

Configure the map settings selected in the map tab.
Components of the toolbar is different with maps displayed.
Usage of components is explained in the page of each map.
The maps of J-SHIS will be displayed in this area.
You can move and zoom in/out the map with your mouse operation on this area.
More detailed information is explained in
"Map Operation".